Outreach Metrics: Essential KPIs for Sales Success
You're sending hundreds of cold messages, but how do you know if your outreach is actually working?
Without the right outreach metrics, you're essentially flying blind. You might be investing significant time and resources into lead generation, but without data-driven insights, you won't know what's working, what's failing, or where to optimize.
The difference between a high-performing sales team and a struggling one often comes down to measurement. Teams that track the right outreach metrics consistently outperform those that don't, achieving higher response rates, more booked calls, and better ROI on their outreach efforts.
In this comprehensive guide, we'll break down the essential outreach metrics you need to track, explain why each matters, and show you how to use data to continuously improve your sales performance.
What Are Outreach Metrics and Why Do They Matter?
Outreach metrics are the quantifiable measurements that reveal whether your sales and marketing outreach campaigns are achieving their objectives. These KPIs (key performance indicators) help you understand how effectively you're reaching prospects, engaging them, and converting them into customers.
Without tracking outreach metrics, you're unable to:
- Identify which messaging resonates with your target audience
- Determine which channels or platforms generate the best results
- Calculate the true ROI of your outreach efforts
- Spot trends in prospect behavior and engagement patterns
- Make data-driven optimizations to improve performance
According to HubSpot's 2024 Sales Report, sales teams that consistently track and optimize their metrics achieve 23% higher close rates than those that don't. This underscores why outreach metrics aren't just "nice to have"-they're essential for sustainable growth.
For teams using Twitter/X for outreach, tracking these metrics becomes even more critical, as the platform's algorithm and audience dynamics require constant optimization.
Core Outreach Metrics You Need to Track
Let's dive into the most important outreach metrics and what each one tells you about your campaign performance.
1. Response Rate
Response rate is one of the most fundamental outreach metrics. It measures the percentage of prospects who respond to your outreach message (via DM, email, etc.).
Formula: (Number of responses / Total messages sent) × 100
Why it matters: Response rate directly indicates whether your message is compelling enough to capture attention. A low response rate often signals issues with:
- Your subject line or opening hook
- Message personalization
- Targeting (you're reaching the wrong people)
- Timing or frequency
Industry benchmarks: According to data from sales automation platforms, average response rates on Twitter/X typically range from 5-15%, depending on your niche and targeting precision. B2B outreach with highly personalized messages often achieves 20%+ response rates.
Optimization tip: A/B test your opening line. The first sentence of your outreach message is critical. Test two different hooks and measure which generates higher response rates, then scale what works.
2. Conversion Rate
Conversion rate measures the percentage of prospects who take a desired action-whether that's scheduling a call, requesting more information, or making a purchase.
Formula: (Number of conversions / Total responses) × 100
Why it matters: Response rate is only part of the equation. A prospect might respond, but if they don't convert to your desired action, your outreach isn't generating ROI. Conversion rate reveals the quality of your messaging and offer.
What to optimize: Once you have engagement, ensure your follow-up messaging, value proposition, and call-to-action are clear and compelling. Many teams see 30-50% of respondents convert to a scheduled call with strong follow-up strategies.
3. Booked Calls
Booked calls (or meetings scheduled) is the outreach metric that directly impacts your pipeline. This measures how many prospects move into your sales conversation.
Why it matters: Booked calls represent qualified interest. This metric tells you how effectively your outreach translates into actual business conversations. For most B2B teams, booked calls are a leading indicator of future revenue.
What to track: Not just the number of booked calls, but also:
- Average time from first outreach to booked call
- No-show rate for booked calls
- Quality of leads booked (are they decision-makers?)
If you want a comprehensive approach to this metric, check out our guide on Booked Calls KPI: The Complete Tracking and Optimization Guide.
4. Click-Through Rate (CTR)
Click-through rate measures the percentage of people who click on a link you've included in your outreach message.
Formula: (Number of clicks / Total messages sent) × 100
Why it matters: CTR indicates engagement with your content. If prospects are clicking your links, they're showing active interest in what you're offering. This is often an early signal before a full response.
Typical benchmarks: Average CTR for Twitter/X DM outreach typically ranges from 2-8%, depending on your targeting and offer relevance.
5. Engagement Rate
Engagement rate is a broader metric that encompasses all interactions with your outreach: replies, likes, retweets, click-throughs, and profile visits.
Formula: (Total engagements / Total impressions) × 100
Why it matters: This gives you a holistic view of how your audience perceives and interacts with your content. High engagement signals that your messaging resonates, even if not all engagements result in immediate conversions.
Advanced Outreach Metrics for Sales Leaders
Beyond the basics, sophisticated sales teams track additional outreach metrics to optimize their strategies and forecast revenue accurately.
6. Cost Per Qualified Lead (CPQL)
Cost per qualified lead divides your total outreach investment (tools, team time, resources) by the number of qualified leads generated.
Formula: Total outreach investment / Number of qualified leads
Why it matters: This metric reveals the true ROI of your outreach efforts. It helps you determine whether your current strategy is cost-effective or if you need to optimize your targeting, messaging, or approach.
Example: If you're spending $5,000/month on outreach tools and team time, and you generate 50 qualified leads, your CPQL is $100 per lead. You can use this to benchmark against industry standards and other channels.
7. Lead Quality Score
Lead quality score measures how likely a generated lead is to close. This is often determined by firmographic data (company size, industry, budget), behavioral signals (engagement level), and fit with your ideal customer profile.
Why it matters: Not all leads are equal. You might generate 100 responses, but if only 20% are actually qualified decision-makers, your effective lead generation is much lower. Quality metrics prevent you from optimizing for vanity numbers.
8. Sales Cycle Length
Sales cycle length measures the average time from initial outreach to closed deal.
Why it matters: This helps you forecast revenue, manage cash flow, and understand how changes in your outreach message affect conversion velocity. Shorter sales cycles mean faster revenue realization.
9. Unsubscribe Rate
Unsubscribe rate measures the percentage of prospects who opt out of further communication or block your account.
Formula: (Number of unsubscribes / Total messages sent) × 100
Why it matters: A high unsubscribe rate signals poor targeting or messaging that's perceived as spam. This metric helps you stay within compliance guidelines and maintain your account's reputation.
Benchmark: Healthy outreach typically maintains an unsubscribe rate below 2-3%. Higher rates indicate you need to refine your targeting or messaging approach.
How to Build a Metrics Dashboard
Tracking outreach metrics is only valuable if you can access, interpret, and act on the data quickly. A metrics dashboard consolidates your key performance indicators in one place.
Essential Components of an Outreach Dashboard
- Daily performance summary: Messages sent, responses, conversions, and booked calls
- Trend analysis: How are metrics trending week-over-week and month-over-month?
- Channel comparison: Which platforms or outreach channels perform best?
- Team performance: How are different team members performing relative to benchmarks?
- Campaign analysis: Which message templates, offers, or targeting segments generate the best results?
- ROI tracking: Cost per qualified lead, customer acquisition cost (CAC), and lifetime value (LTV)
For teams managing multi-account outreach campaigns, comprehensive tracking becomes even more critical to ensure compliance and maintain account health. Our guide on Team Operations: Running Multi-Account Outreach Safely provides additional insights on scaling outreach metrics across your organization.
Optimizing Outreach Metrics: Actionable Strategies
Now that you understand which metrics to track, let's explore how to optimize each one.
Improve Response Rate
Strategy 1: Hyper-personalization Generic messages get ignored. Research each prospect before reaching out. Reference their recent tweets, job change, or company news. Personalized outreach significantly outperforms template messages.
Strategy 2: Strong opening hook Your first line determines whether prospects read further. Instead of "Hi [Name], I wanted to reach out..." try something specific and relevant: "Saw you just launched [product feature]-curious how you're handling [related challenge]?"
Strategy 3: Optimal timing When you send your outreach matters. Test different days and times. Generally, Tuesday-Thursday, 10 AM-2 PM tends to perform well for B2B, but your audience might vary.
Strategy 4: Mobile-first messaging Most Twitter/X users read messages on mobile. Keep messages concise, avoid long paragraphs, and ensure your call-to-action is crystal clear.
Improve Conversion Rate
Strategy 1: Clear value proposition Within the first message or follow-up, communicate why this prospect should engage. What's the specific benefit for them?
Strategy 2: Multi-step sequences One message rarely converts. Implement a follow-up sequence with different angles and timing. Our comprehensive guide on DM Sequences and Cadence: High-Converting X Outreach Guide breaks down exactly how to structure effective follow-up sequences.
Strategy 3: Objection handling Anticipate common objections and address them proactively in your messaging. When prospects raise concerns, have prepared responses that move the conversation forward. For deeper strategies, see our guide on Objection Handling Scripts: Convert Hesitant Leads Into Customers.
Improve Booked Calls KPI
Strategy 1: Frictionless scheduling Don't ask prospects to "check your calendar and find a time." Use a calendar tool (Calendly, Acuity, etc.) and send a direct link. Reduce friction at every step.
Strategy 2: Qualify before the call Not every response deserves a call. Ask qualifying questions to ensure they're a good fit before investing your sales team's time.
Strategy 3: Reduce no-shows Send a reminder 24 hours before the call. Some teams see 20-30% no-show rates without reminders; this drops to under 5% with a simple reminder message.
Measuring Outreach Metrics Across Different Platforms
If you're running outreach across multiple channels, your metrics frameworks might vary by platform. For X/Twitter outreach, which requires specialized automation tools, you'll want to focus specifically on DM metrics and engagement patterns unique to that platform.
Our guide on Social Media Marketing: Organic and Paid Growth Strategies for 2025 covers how to integrate outreach metrics with broader organic and paid social strategies.
Common Mistakes in Outreach Metrics Tracking
Mistake 1: Focusing only on volume Sending 1,000 messages that generate 10 qualified leads is worse than sending 100 highly personalized messages that generate 20 leads. Quality matters more than volume.
Mistake 2: Ignoring follow-up metrics Many teams track only initial response rates but don't measure how well their follow-up sequences convert. Your follow-up often determines final outcomes.
Mistake 3: Not segmenting results If you're mixing results from different audience segments, messaging types, or campaigns, you won't identify what's actually working. Always segment your data.
Mistake 4: Setting unrealistic benchmarks Your outreach metrics are unique to your industry, audience, and offer. Don't benchmark against random industry "averages" if they don't apply to your situation.
Mistake 5: Failing to act on data Tracking metrics without optimization is useless. Review your data weekly, identify what's underperforming, and implement changes.
Outreach Metrics Tools and Automation
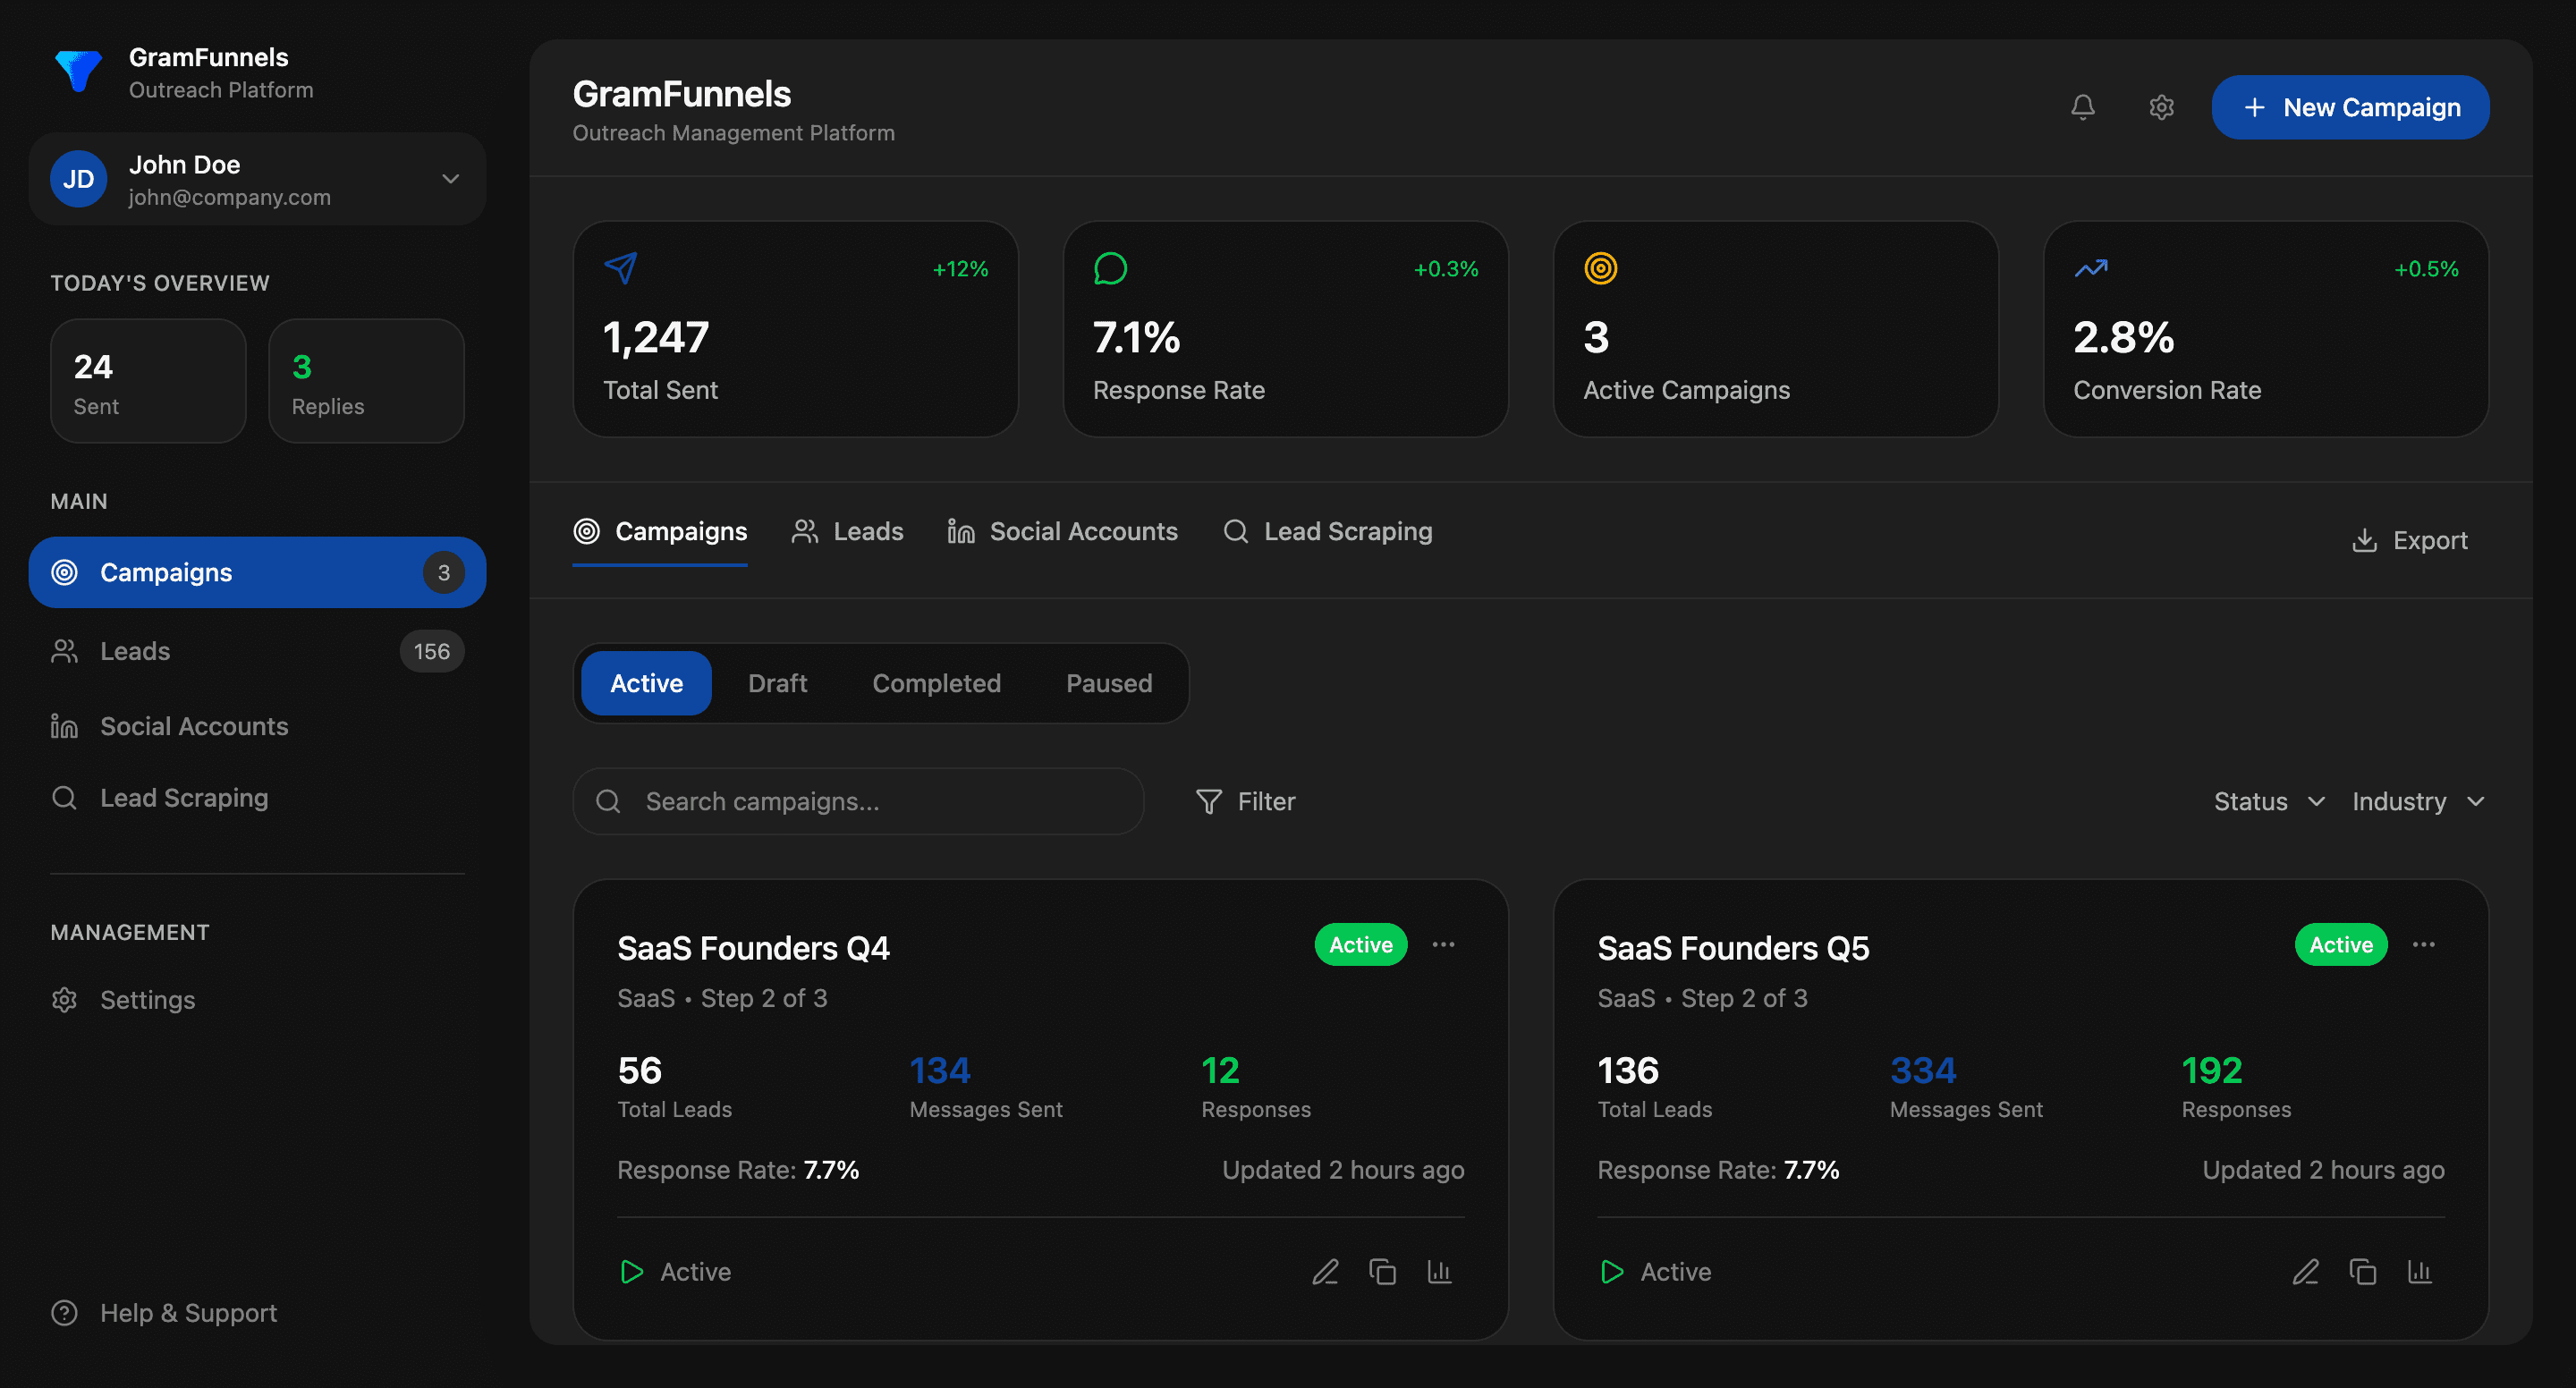
Modern outreach platforms like GramFunnels help automate metric tracking for Twitter/X outreach. By centralizing your DM campaigns, lead tracking, and response management, you can automatically capture and analyze outreach metrics without manual data entry.
Key features to look for in an outreach metrics tool:
- Real-time tracking of sends, responses, and conversions
- A/B testing capabilities for messages and targeting
- CRM integration to track leads through the sales funnel
- Automated reporting and dashboards
- Compliance monitoring to prevent account issues
If you're evaluating different X outreach tools, our comparison guide on Best Drippi Alternatives for Social Media Automation in 2025 outlines how different platforms approach metrics tracking and reporting.
Putting It All Together: Your Outreach Metrics Action Plan
Here's a practical roadmap to implement comprehensive outreach metrics tracking:
Week 1: Identify your top 5-7 outreach metrics based on your sales goals. Set up a simple tracking system (spreadsheet or dashboard).
Week 2: Establish baseline measurements for each metric. Run one outreach campaign and capture all data points.
Week 3-4: Analyze your baseline data. Identify which metrics are strongest and which need improvement.
Week 5+: Implement optimization strategies for your weakest metrics. Run weekly reviews and make incremental improvements.
To build a complete outreach system that scales, consider developing comprehensive sales funnels. Our guide on How to Build High-Converting Sales Funnels for Social Media shows how to integrate outreach metrics into a broader conversion system.
Conclusion: Turn Outreach Metrics Into Revenue
Outreach metrics are your roadmap to sales success. By systematically tracking response rates, conversion rates, booked calls, and other key indicators, you gain visibility into what's working and where to optimize.
The sales teams that consistently outperform aren't just working harder-they're working smarter by letting data guide their decisions. They test different messaging, targeting, and follow-up approaches, measure the results, and double down on what works.
Start tracking your outreach metrics today. Even if your current systems aren't perfect, beginning to measure gives you a baseline to improve from. Within weeks, you'll likely identify opportunities to boost your response rate, conversion rate, and booked calls-directly improving your revenue.
The data is there. The question is: are you going to use it?